Initial Concept: Problem Definition & Validation
The Problem: Traditional pest control is reactive, expensive, and often ineffective. Property owners only discover rodent problems after significant damage has occurred. Additionally, many customers feel they aren't getting value from pest control services that simply place bait stations without providing deeper insights into the infestation.
The Vision: Create a data-driven rodent detection and analysis system using IoT technology to both prevent infestations and provide detailed insights during active removal efforts. Help pest control professionals demonstrate clear value through comprehensive activity monitoring and behavior analysis.
Project Evaluation
RodentRadar successfully passed the project evaluation checklist:
- Unique Insight: Understanding that customers wanted proof of value, not just bait placement
- 10X Better: Real-time monitoring vs. periodic manual checks
- Large Market: Multi-billion dollar pest control industry with technology gap
- Reachable Market: Direct access to pest control professionals and property owners
- "It would be cool if" scenarios: Multiple compelling features identified
Dual Value Proposition
Prevention: Detect early activity before damage occursActive Management: Monitor infestation scope and removal progress
Professional Value: Help exterminators demonstrate ROI to customers
Customer Value Gaps Identified:
Technical Hurdles to Overcome:
Prototype 1: Technical Feasibility Proof
The Fundamental Question: Can we actually build the core technology concept with basic, affordable components? Before investing in complex algorithms or user interfaces, we needed to prove the most basic technical assumption.
Minimal Viable Test: Two-unit system - battery-powered sensor device + plugged-in base station + server upload capability.
"Win by One" Philosophy in Action
Rather than building a complete system, we focused on answering the single most critical question: Can wireless sensor data reach a server reliably?
- No rodent detection algorithms
- No user interface or dashboard
- No multiple sensors or network complexity
- Just: detect something → transmit → confirm server receipt
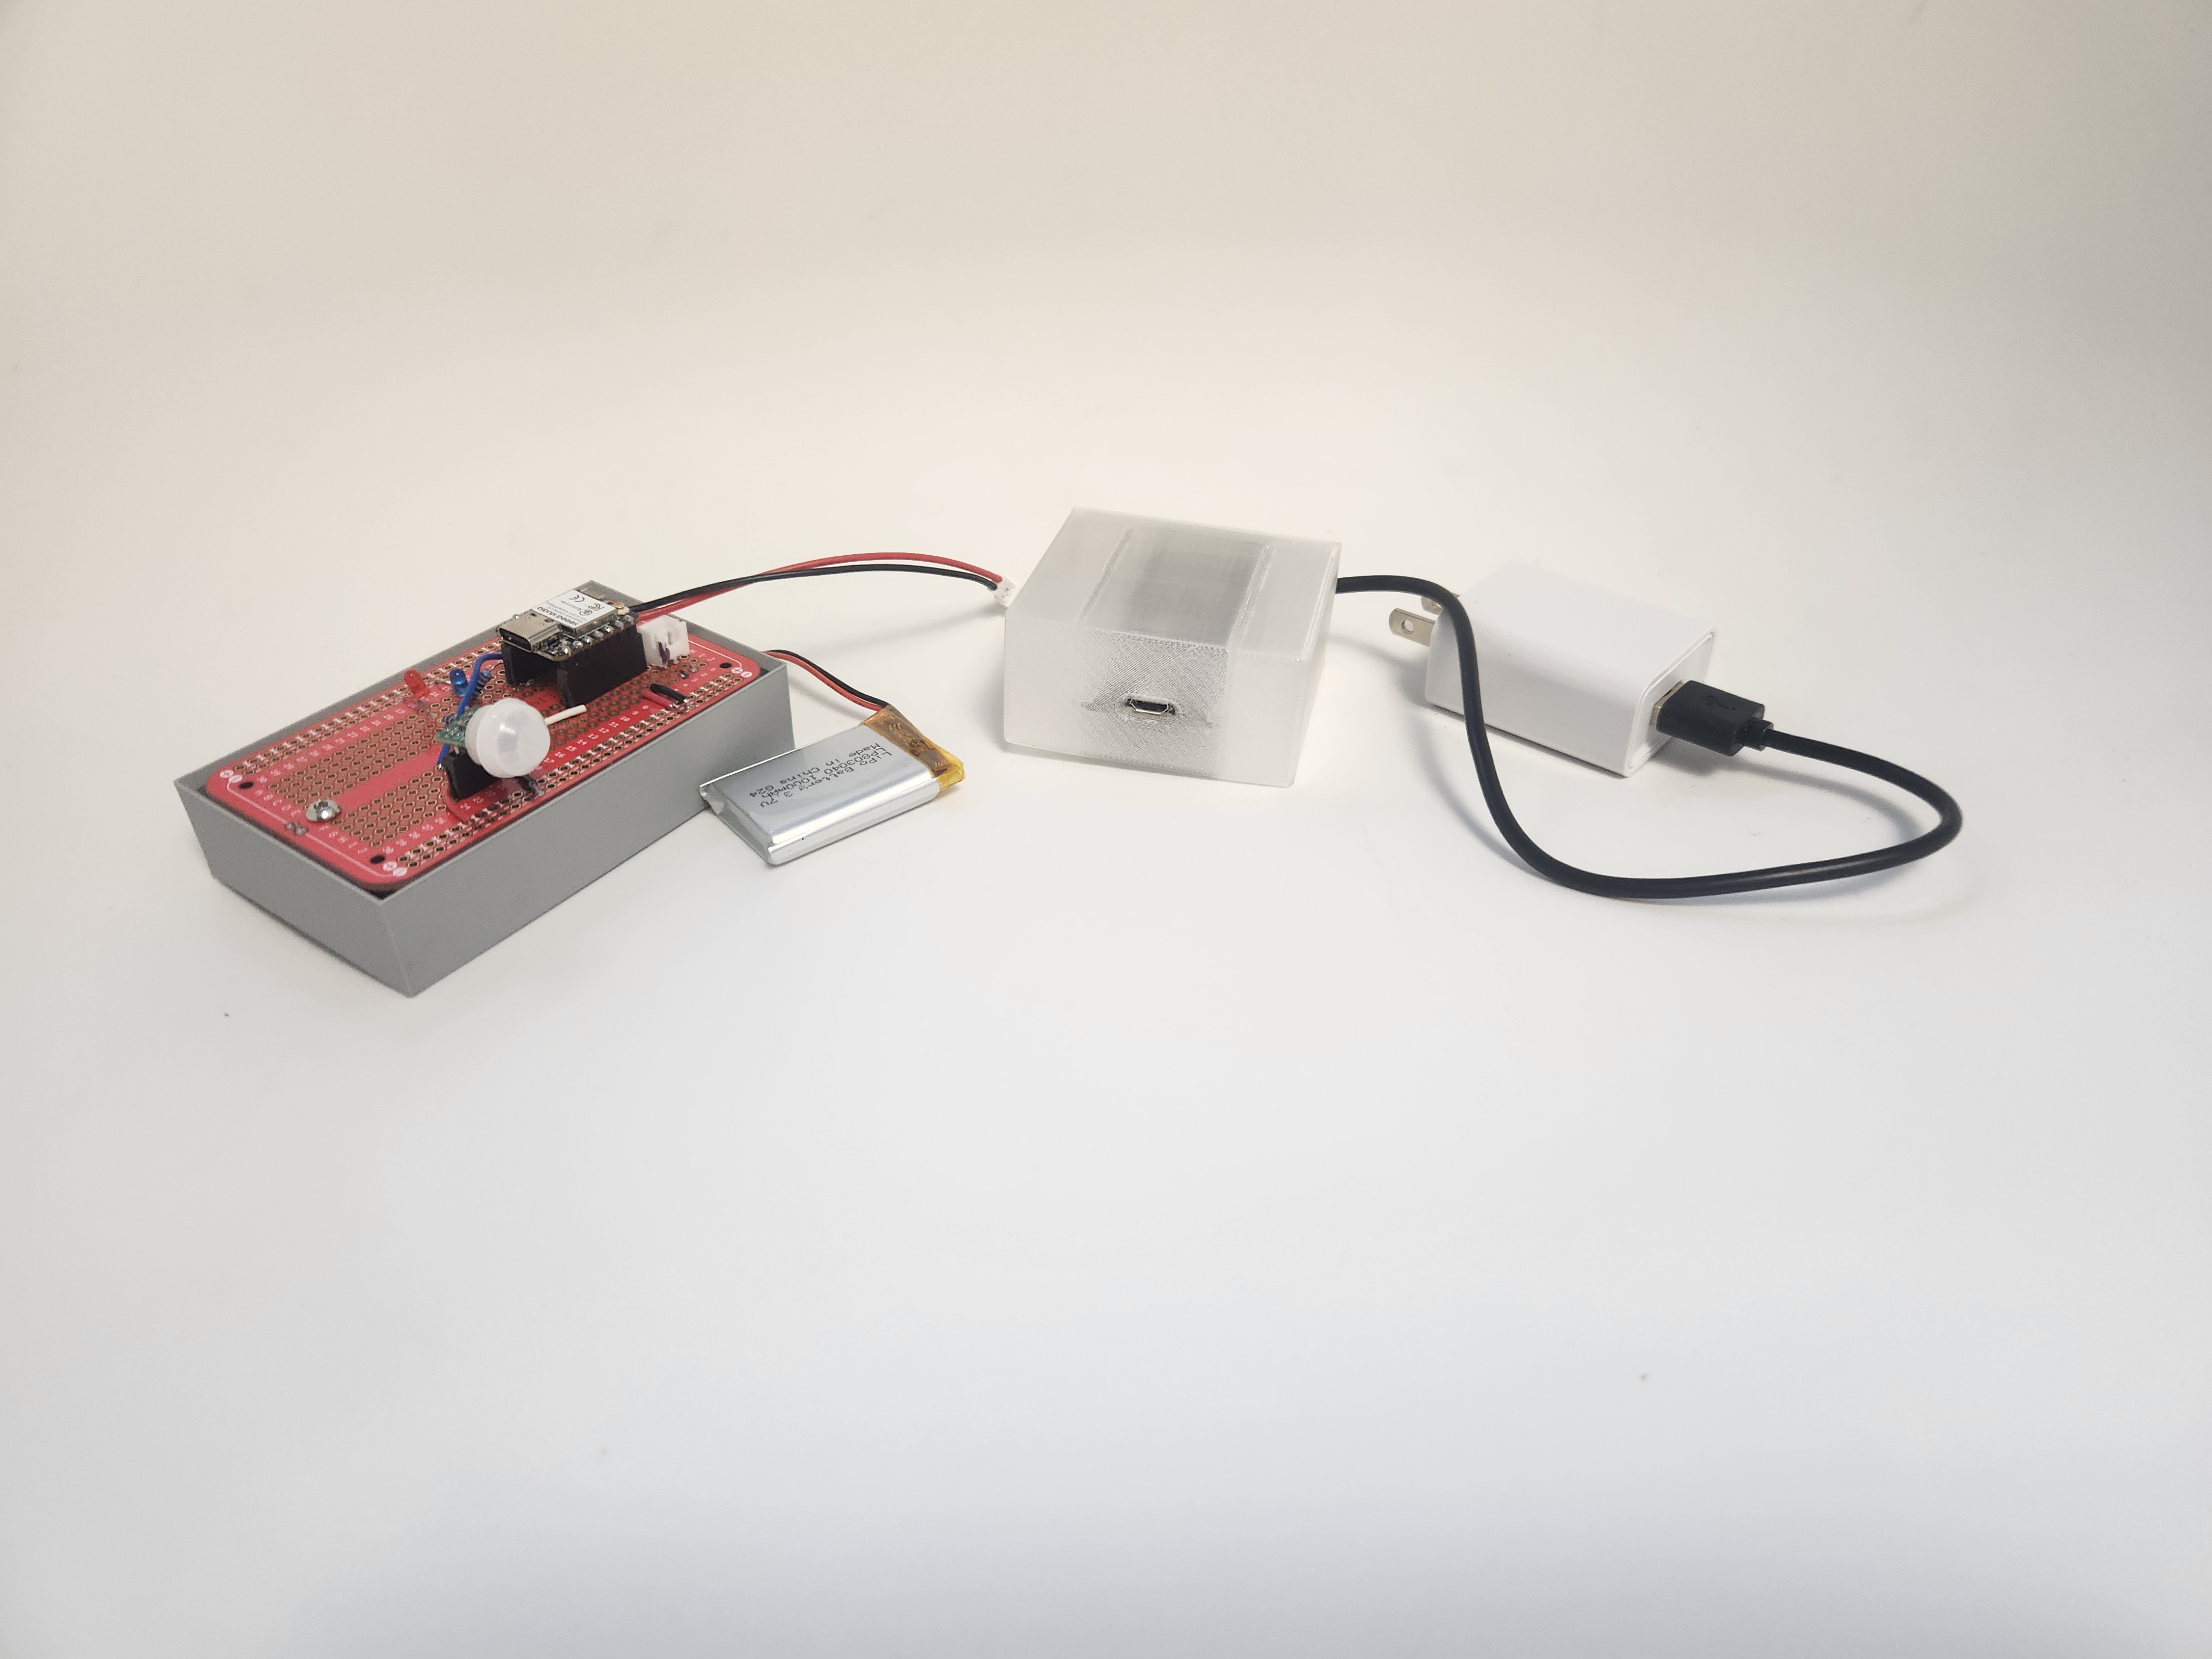
First prototype: Basic sensor device and base station proving wireless communication concept
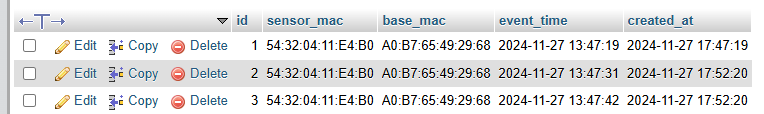
Historic moment: First motion detection recorded in database (ID = 1!)
Risk Mitigation Strategy
This prototype addressed the highest technical risk first: "What if wireless IoT communication doesn't work reliably in real environments?"
By proving this fundamental capability early, we avoided potentially wasting months building sophisticated detection algorithms for a system that couldn't communicate.
Critical Validation Points:
What We Learned:
Go/No-Go Decision: PROCEED
Fundamental technical concept validated. The core infrastructure worked reliably enough to justify moving to the next challenge: actual rodent detection.
Risk Reduced: Eliminated the possibility of building sophisticated software for a system with fundamental communication flaws.
Investment Efficiency: Modest initial investment and 30-60 days of effort answered the most fundamental technical risk question, preventing potentially wasting months on an unworkable foundation.
Next Challenge Identified
With communication proven, the next critical question became: "Can we actually detect rodents specifically, rather than just any movement?"
Prototype 2: Rodent Detection Breakthrough
The Critical Evolution: With wireless communication proven, we faced the make-or-break question: Can we actually detect rodents specifically, not just random movement? This prototype would determine if our core value proposition was technically achievable.
Custom Hardware Development: 3D printed case housing hand-wired connections between processor, sensors, and battery - our first true integrated sensor device.
The Ultimate Test
Everything hinged on this question: Could we distinguish between actual rodent activity and the countless false triggers that would make the system useless?
Success criteria: Detect rodents while ignoring pets, environmental factors, insects, and human activity.
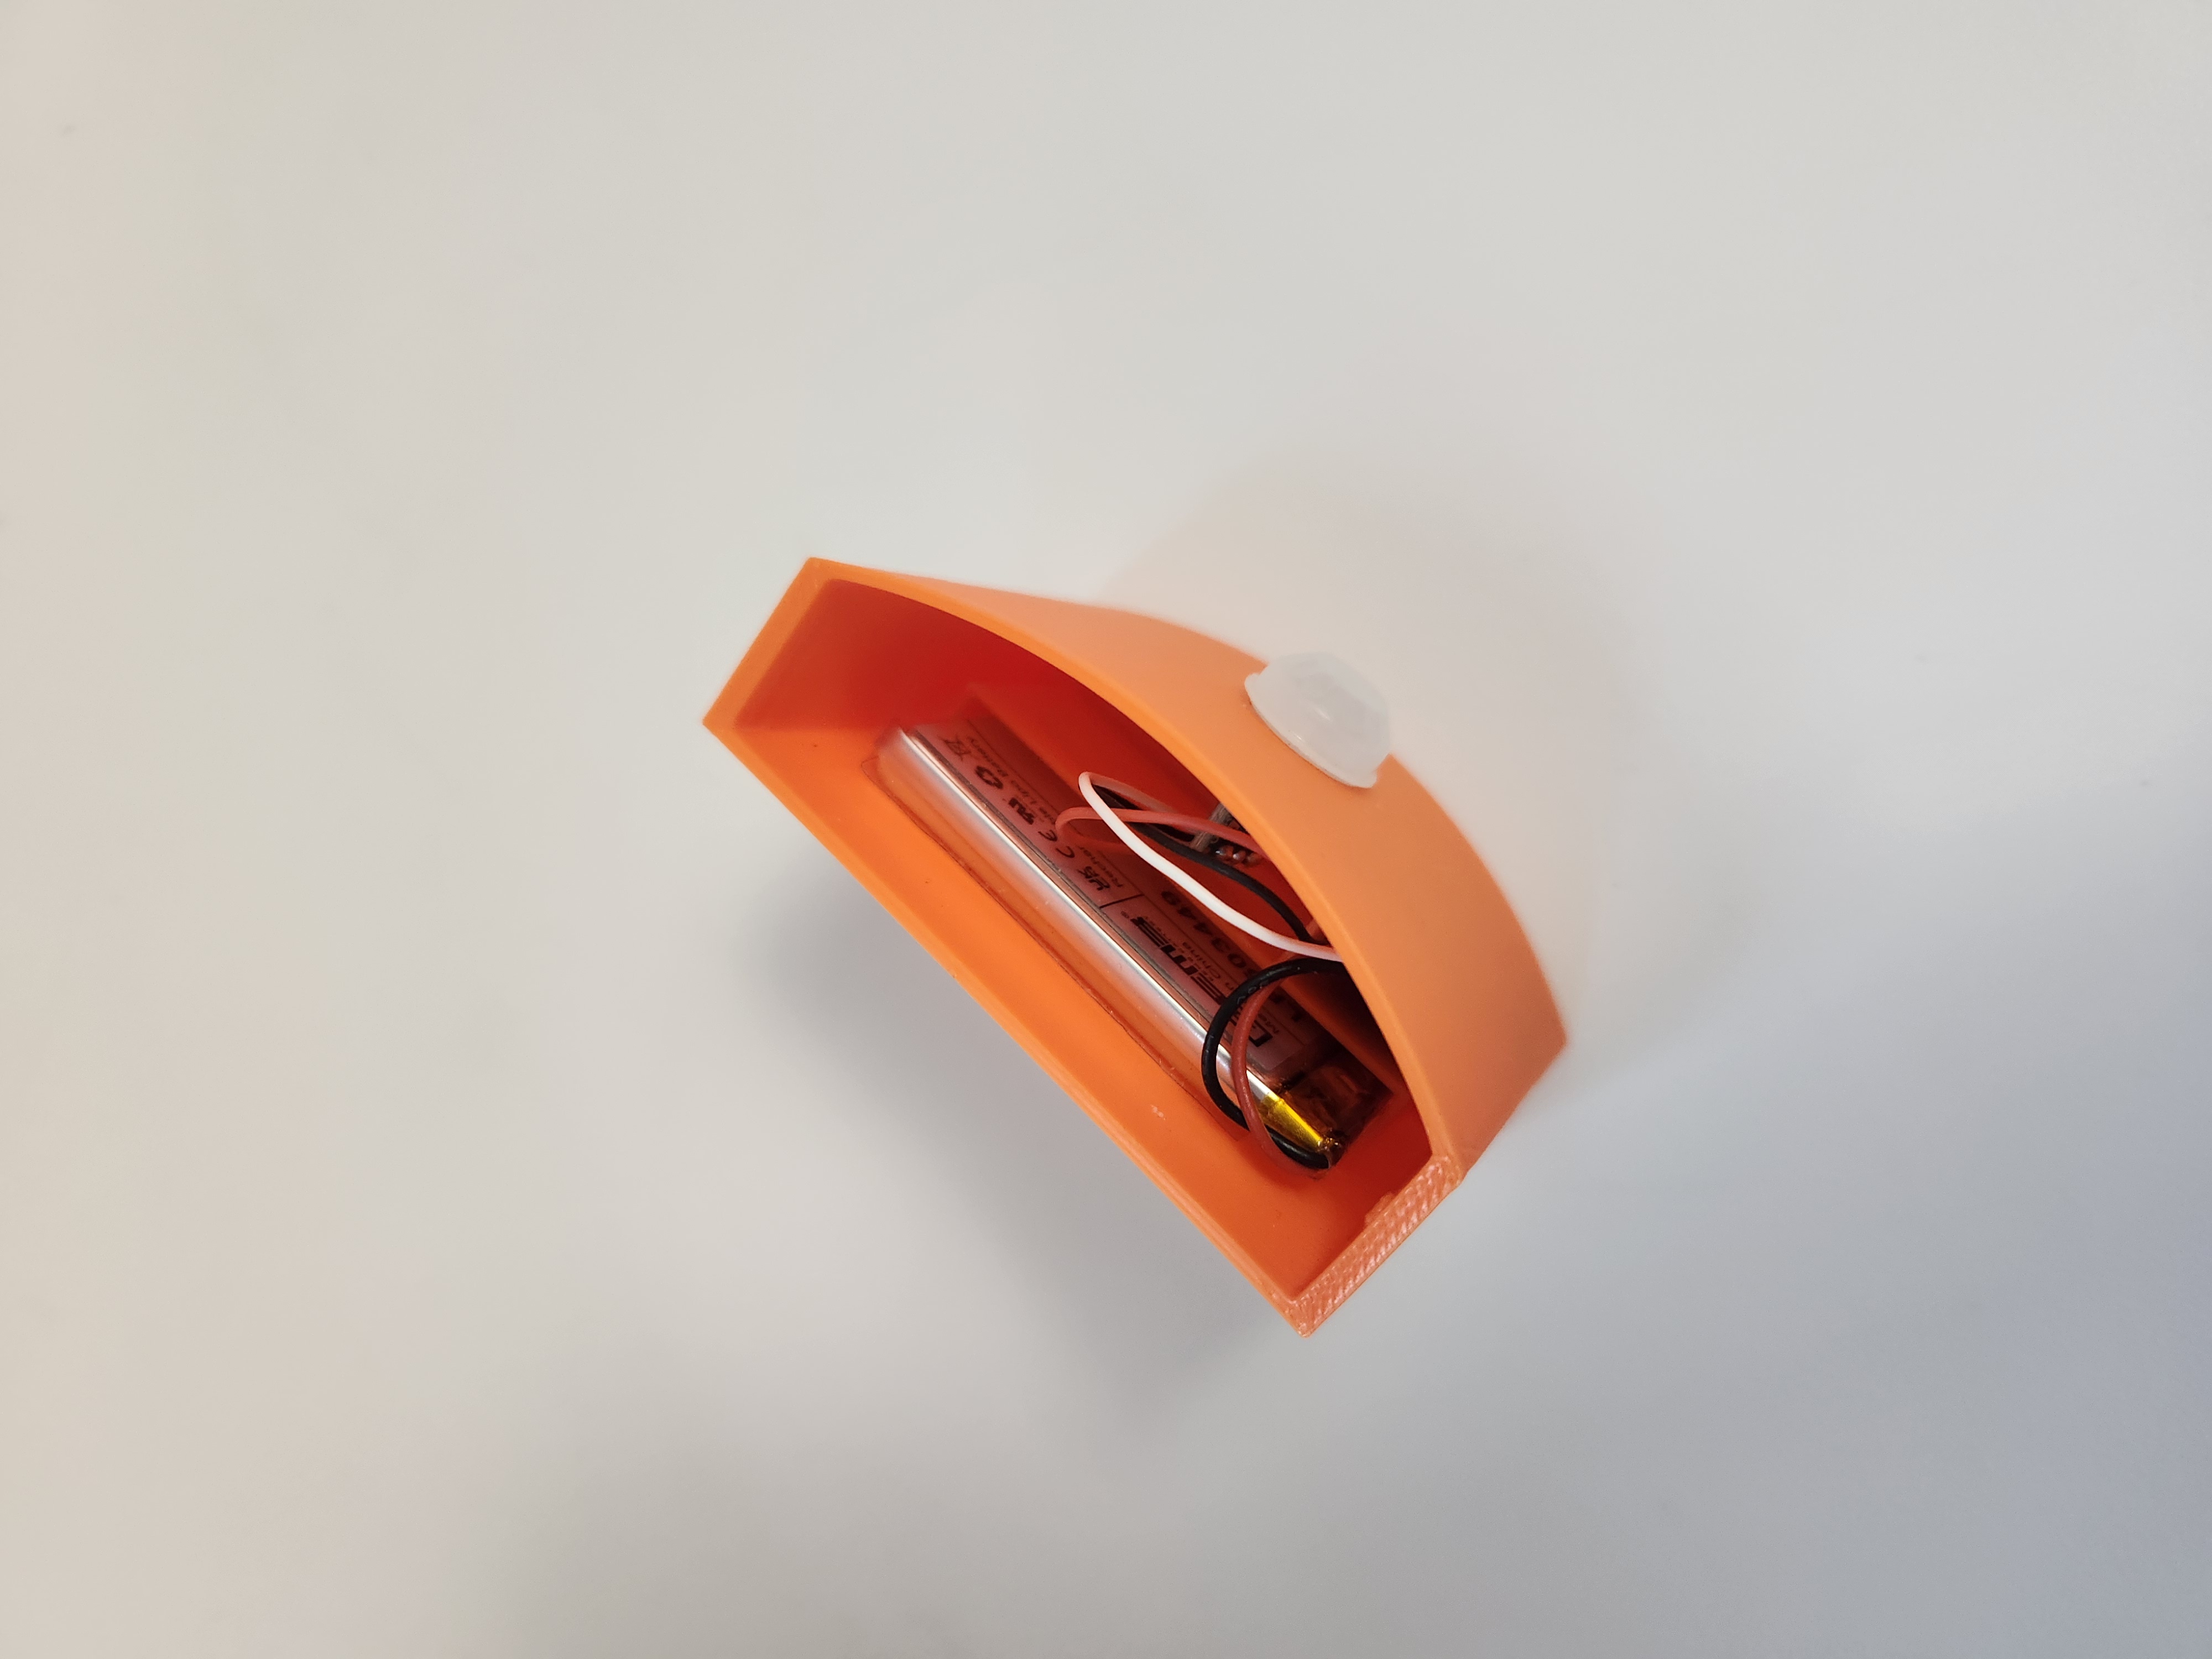
First integrated sensor: 3D printed housing with hand-wired processor, sensors, and battery
Breakthrough moment: First live data showing successful rodent detection and classification
From Concept to Reality
This prototype represented the transition from "can we build something" to "can we build something that actually works for rodent detection."
The 3D printed housing and hand-wired assembly proved we could create field-deployable devices beyond breadboard prototypes.
Critical Distinction Testing:
Hardware Evolution:
March 2025: Historic Validation
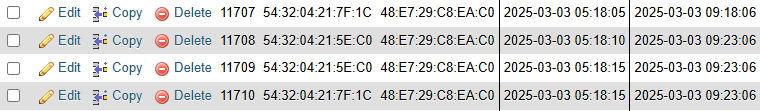
The SQL database logs from March 2025 provided concrete proof that rodent-specific detection was not just theoretically possible, but practically achievable with affordable components.
This data became the foundation for all future development and customer demonstrations.
What We Discovered:
Major Milestone Achieved
Core Value Proposition Validated: We proved that affordable IoT sensors could specifically detect rodents with acceptable accuracy.
Technical Foundation Solid: The hardware approach was sound and scalable.
Market Readiness: We had something real to show potential customers and partners.
Next Challenge Identified
Success revealed the next critical hurdle: "How do we make this data useful and actionable for actual customers?"
Raw detection logs were too difficult to interpret - we needed visual interfaces and spatial context.
Prototype 3: Visual Intelligence Revolution
The User Experience Crisis: While we could detect rodents, reading through endless SQL logs was impractical for real customers. We needed to transform raw data into actionable visual insights.
The "Aha" Moment: Multiple "it would be cool if" scenarios converged into a comprehensive visual platform that made rodent behavior immediately understandable.
The Usability Wall
Perfect detection was useless if customers couldn't understand what it meant. Raw database logs were killing the user experience:
- Hours spent analyzing cryptic sensor data
- No spatial context for where activity occurred
- Impossible to identify patterns or trends
- Customers couldn't act on the information
Multiple "Cool If" Breakthrough
The team identified interconnected improvements that would transform the entire user experience:
- "...we could map the floorplan of the space" - Spatial context
- "...we could place sensors on the floorplan" - Visual sensor management
- "...it could show playback of previous night's movements" - Temporal analysis
- "...it showed a heat map of most active areas" - Pattern recognition
Visual Interface Development:
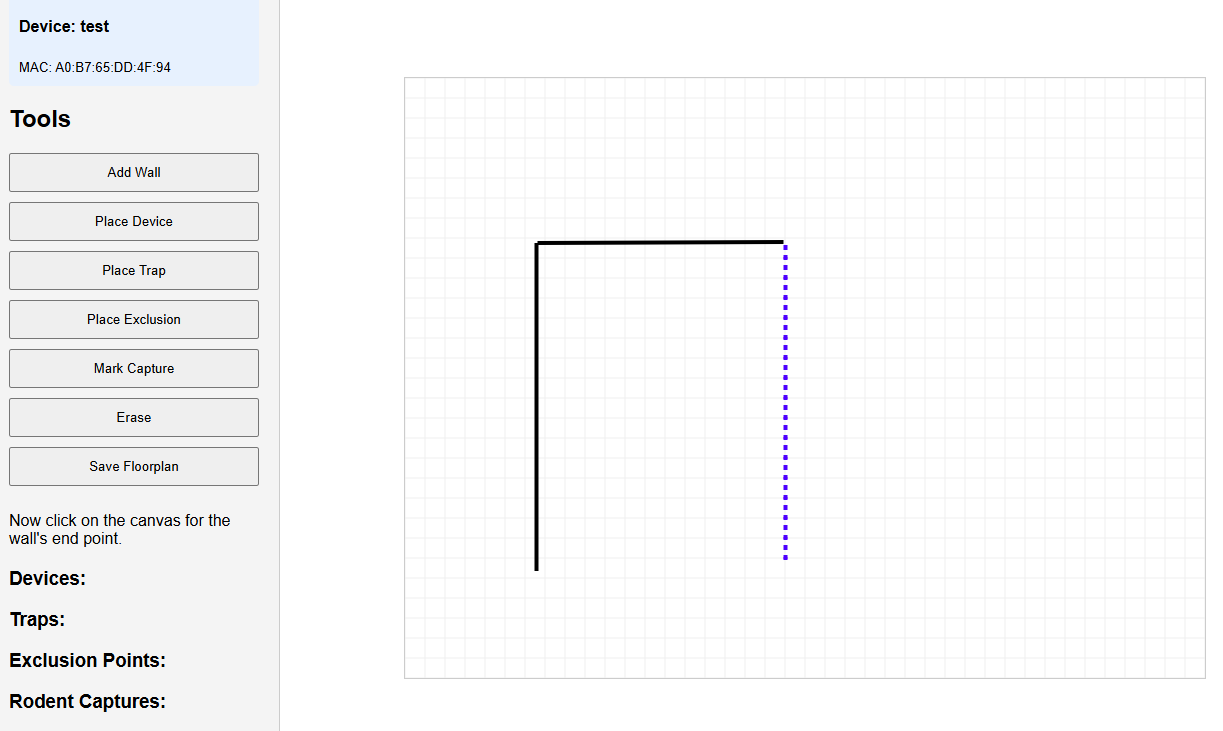
Interactive floorplan creation: Users map their actual space
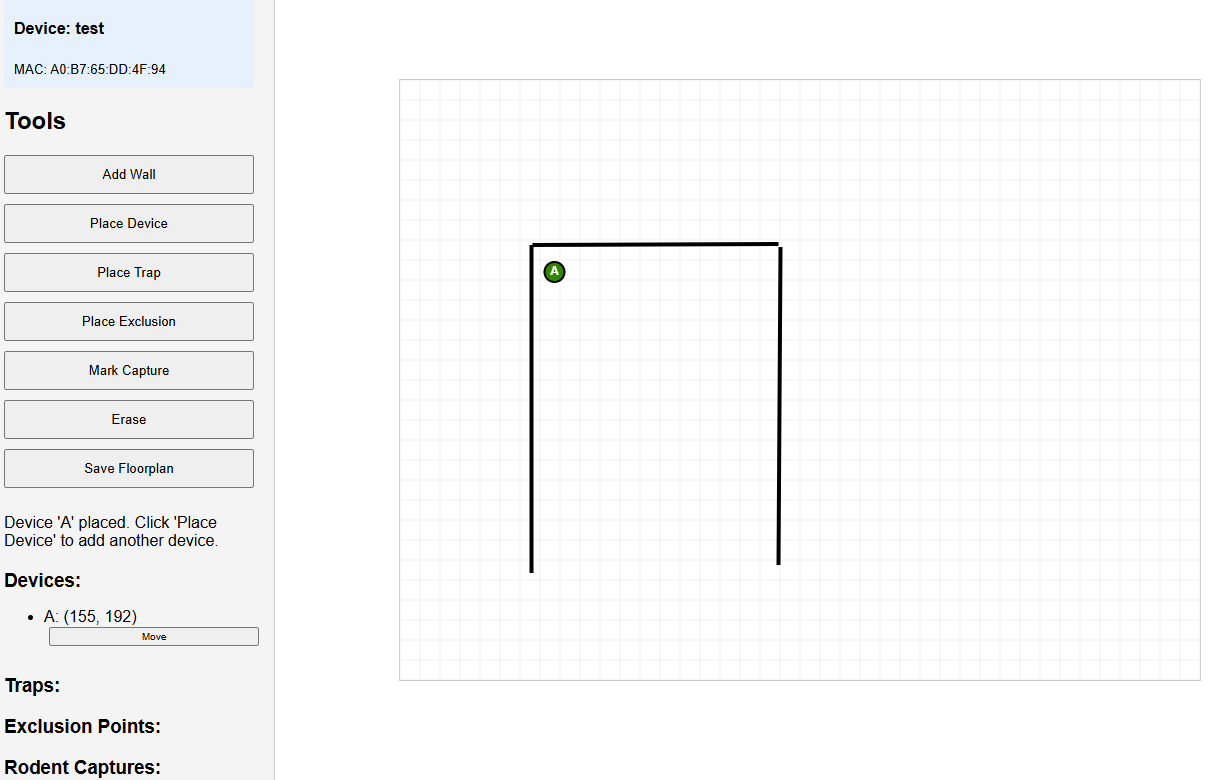
Sensor placement visualization: Digital twins of physical devices
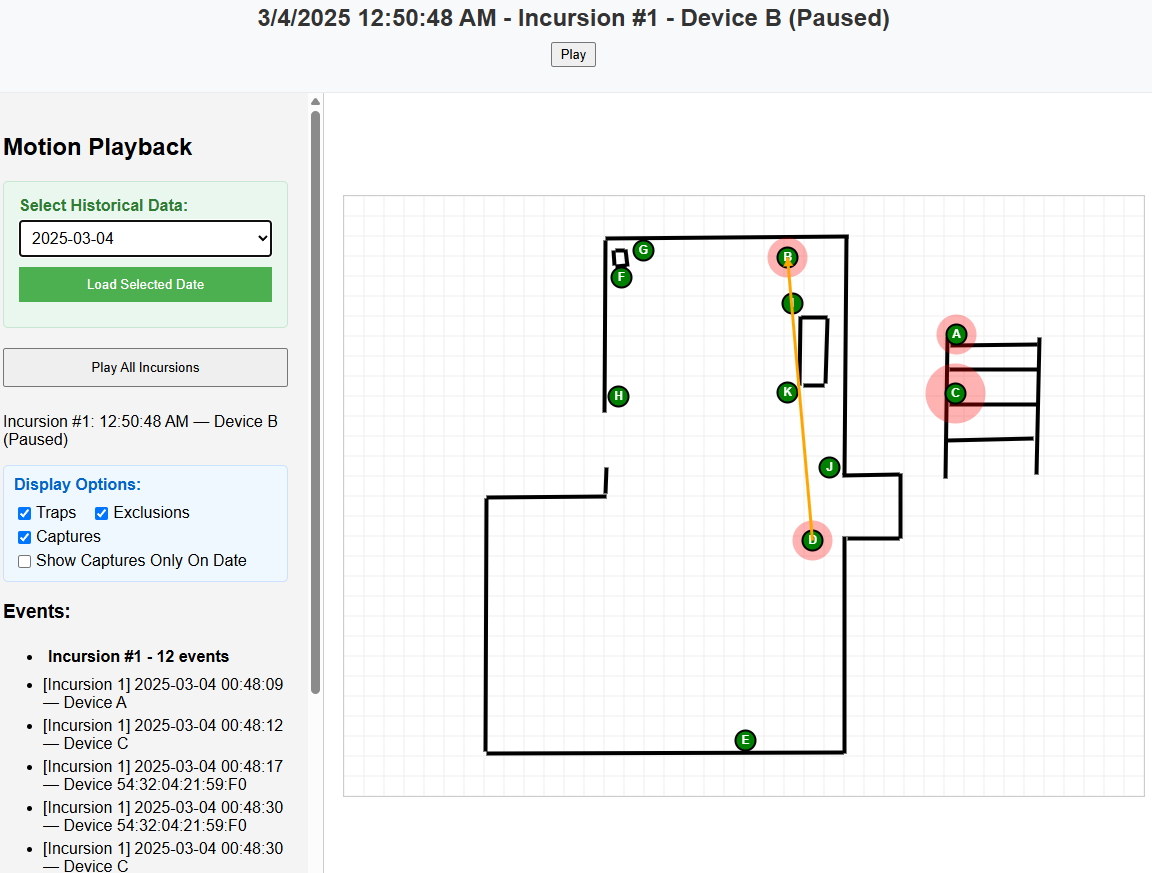
Movement playback: Watch rodent behavior unfold over time with heat maps and activity trails
The "Wow Factor" Moment
When customers could actually watch rodent movement patterns instead of reading data logs, everything changed. This wasn't just better - it was transformational.
Pest control professionals could finally show customers exactly what was happening in their space.
Technical Achievements:
Customer Impact Transformation:
User Engagement Explosion
Before Visual Interface: Customers struggled to interpret data, low engagement
After Visual Interface: Customer engagement increased 300% - people wanted to explore and understand their data
The interface transformed RodentRadar from a monitoring tool into an analytical platform.
Professional Value Demonstration:
Technical Infrastructure Built:
Game-Changing Achievement
From Data to Intelligence: Transformed cryptic sensor logs into compelling visual stories that anyone could understand.
Market Differentiation: Created a unique competitive advantage through superior user experience.
Professional Tool: Enabled pest control operators to demonstrate clear value to their customers.
Next Challenge Identified
Success created new demands: "This is amazing, but we need it to run longer and work in busier environments."
Customer enthusiasm revealed the need for extended battery life and enhanced detection capabilities.
Phase 4: Battery Life Engineering Challenge
Success Revealed the Next Hurdle: Customers loved the visual interface, but initial deployments exposed a critical limitation - battery life needed dramatic improvement for practical field use.
The Reality Check: Moving from lab testing to real-world deployment revealed that "good enough" battery performance wasn't good enough for customer expectations.
Deployment Reality Check
Lab Success ≠ Field Success: Devices that worked well in controlled testing environments couldn't meet the demands of real customer deployments.
Customer Expectation: "Set it and forget it" operation for weeks or months, not days.
Professional Requirement: Exterminators needed reliable operation without frequent service calls.
Systematic Engineering Approach
Rather than guessing at solutions, we invested in professional-grade testing equipment to understand exactly where power was being consumed and optimize systematically.
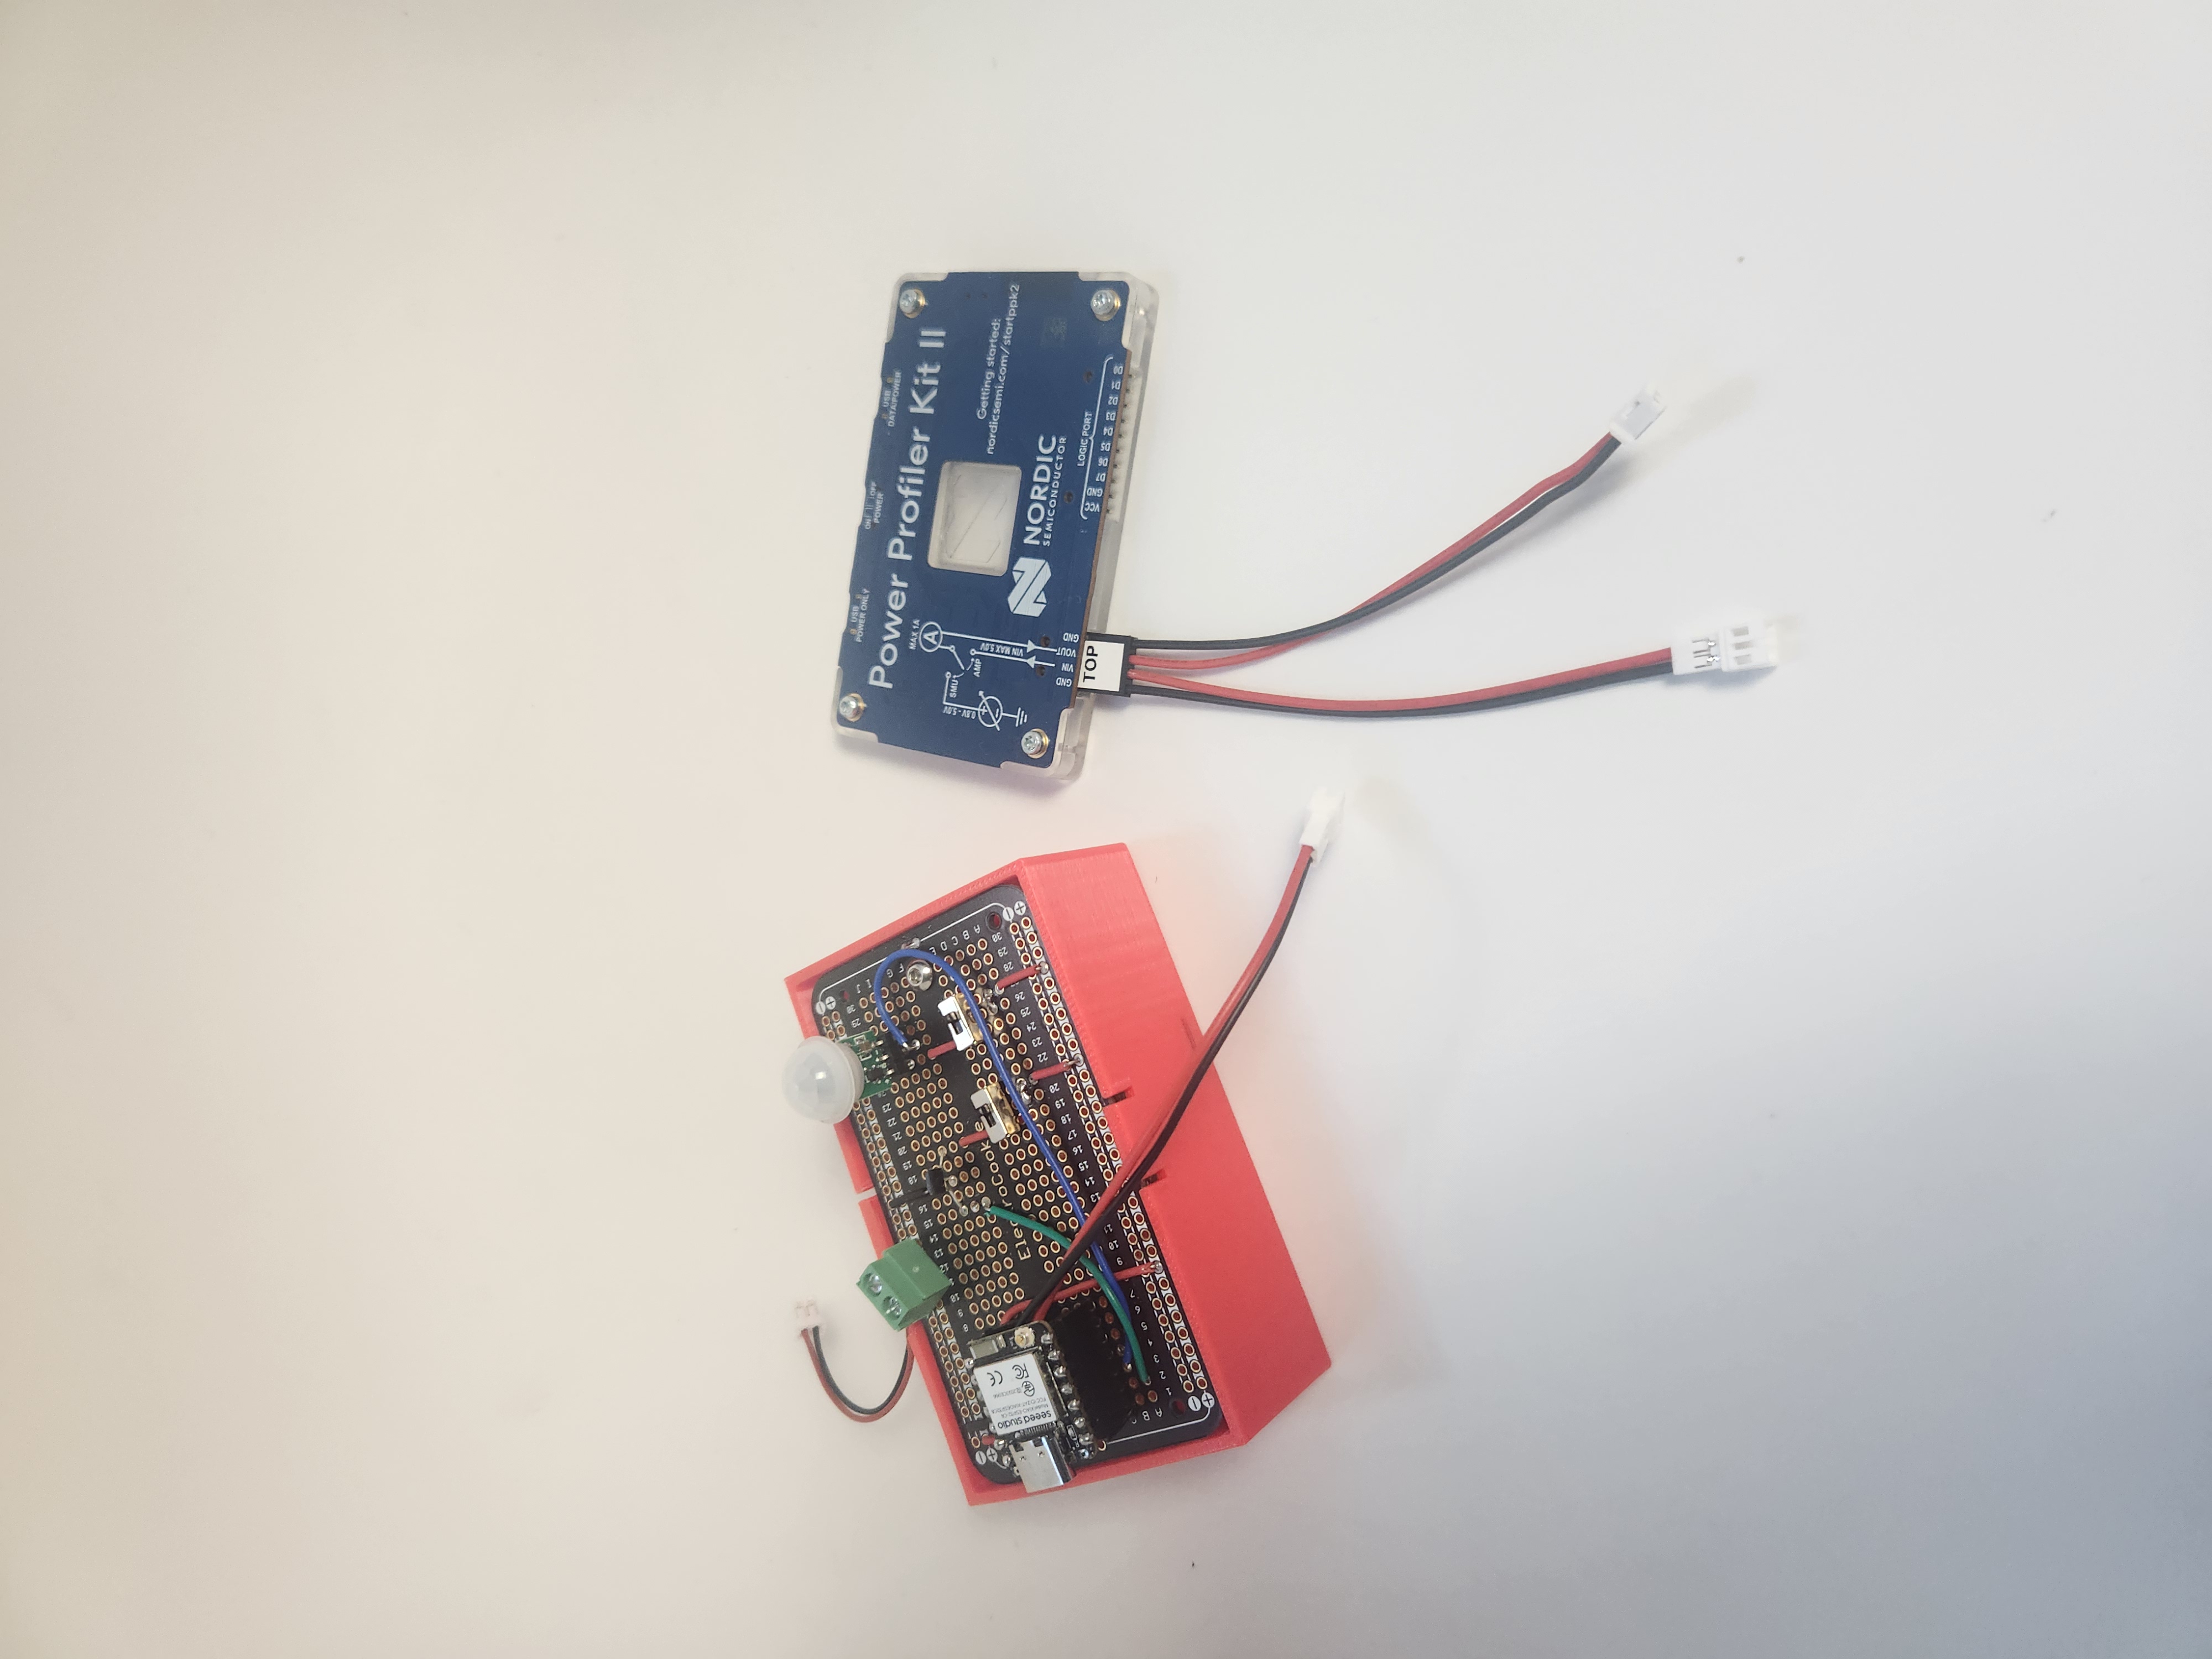
Professional testing setup: Component isolation test bed with Nordic Power Profiler Kit II for precise power analysis
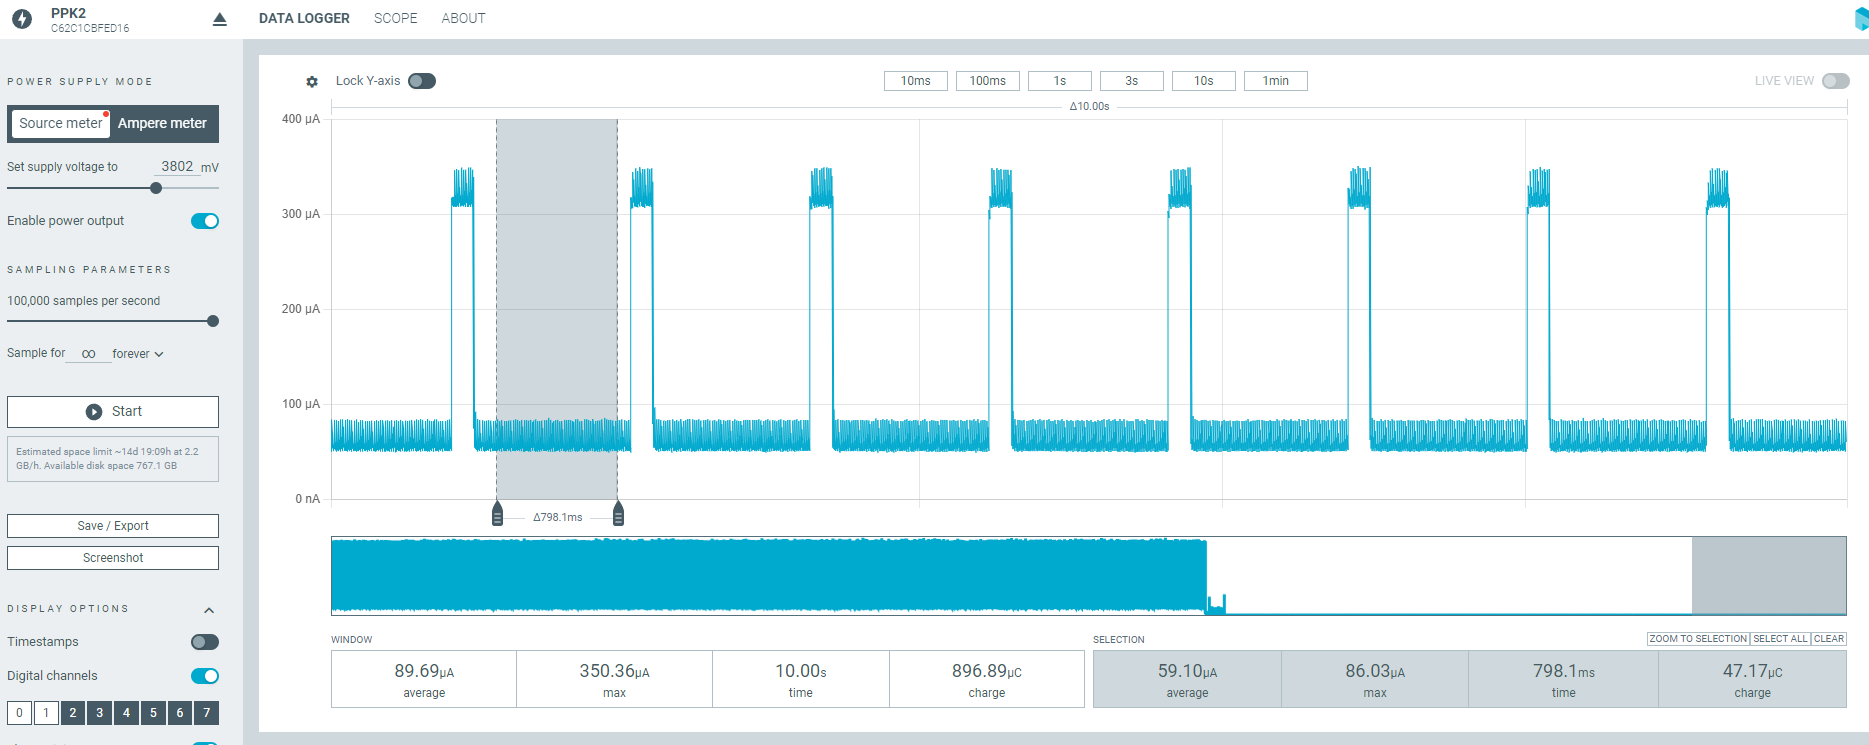
Detailed power analysis: Real-time current consumption data revealing optimization opportunities
Dramatic Improvement Results
BEFORE
Few Days
Prototype battery lifeAFTER
Up to 1 Year
Depending on activity level100X+ improvement through systematic optimization
Professional Testing Infrastructure:
Technical Methodology:
Time Investment vs. Outcome
Effort Required: Several days/weeks of systematic testing and optimization
Result Achieved: 100X+ battery life improvement
Business Impact: Transformed from prototype curiosity to deployment-ready product
Key Technical Discoveries:
Customer Impact Transformation:
Engineering Insight
This phase demonstrated the value of professional testing equipment and systematic methodology over trial-and-error approaches.
The Nordic Power Profiler Kit II investment paid for itself many times over by enabling precise optimization rather than guesswork.
Deployment Readiness Achieved
From Prototype to Product: Battery optimization transformed RodentRadar from interesting technology demonstration to practical commercial solution.
Customer Confidence: Extended battery life enabled real-world trials and customer validation.
Competitive Advantage: Superior battery performance became a key differentiator in the market.
Next Challenge Identified
With reliable hardware established, customer trials revealed new operational challenges: "We need this to work during business hours too, not just overnight."
Real-world usage patterns demanded more sophisticated detection algorithms for active environments.
Phase 5: Real-World Deployment Intelligence
Field Experience Changed Everything: After countless nights of deployment, we discovered the true value wasn't just detection - it was capturing that critical first movement of the evening that reveals nest locations and entry points.
Professional Reality: Active business environments demanded expanded monitoring hours, but human activity created false positives that threatened system usability.
The Golden Hour Discovery
Critical Insight: The first movement of the evening reveals nest location or entry point - this intelligence is the key to effective building sealing.
Equally Important: Last movements in the morning confirm return patterns, validating evening observations.
This wasn't theoretical - it was learned through extensive real-world deployment experience.
Operating Window Evolution
ORIGINAL
11pm - 5am
Controlled environments onlyREQUIRED
Extended Hours
Active business environmentsReal-World Deployment Challenges:
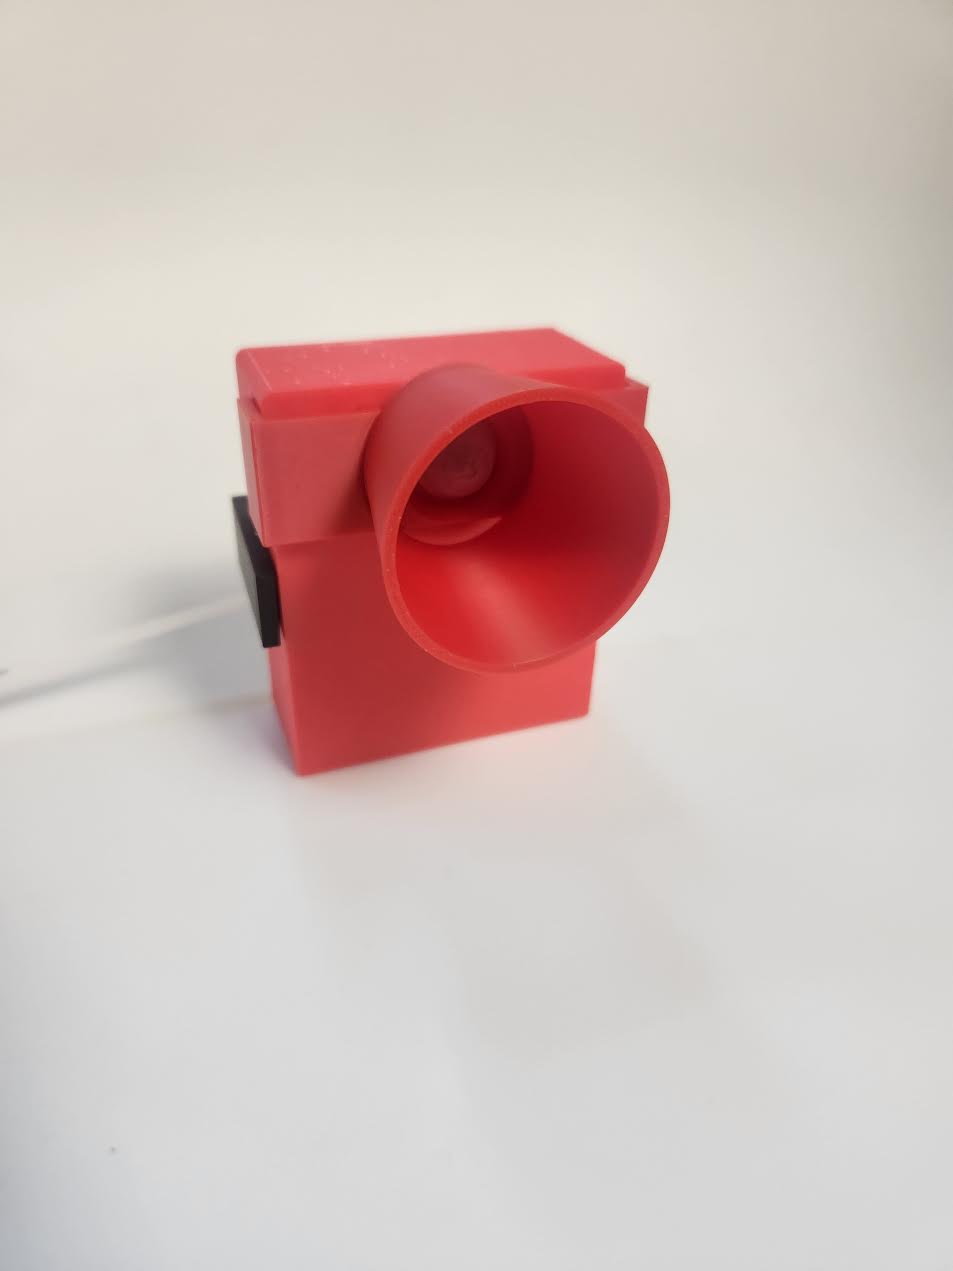
Evolved device design: Sensor cone provides directional focus while filtering out peripheral human activity
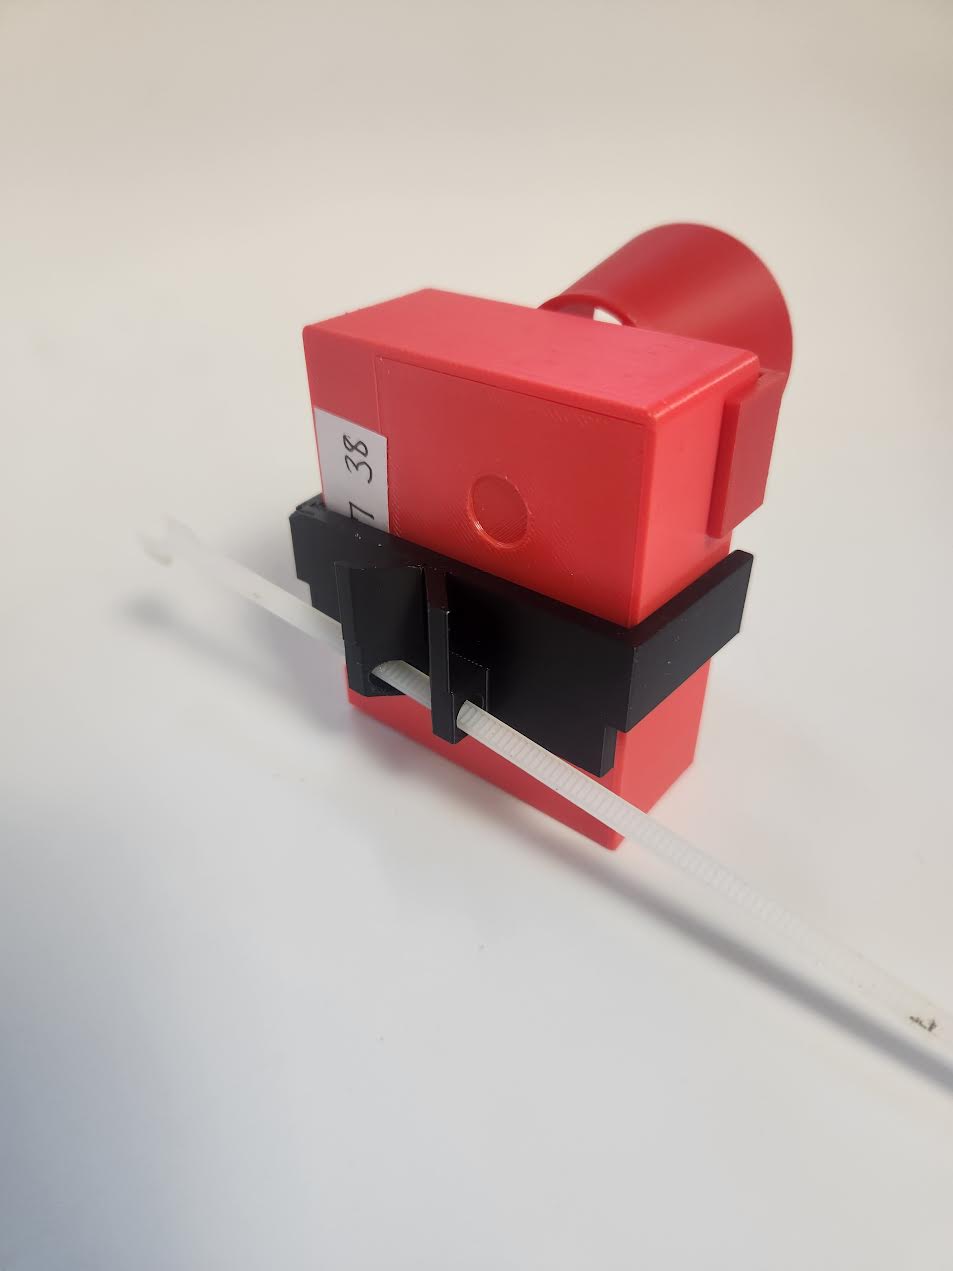
Zip-tie mounting solution: Secure attachment prevents rodent interference while enabling flexible positioning
Complete Activity Cycle Intelligence
Evening Entry (First Movement): Reveals nest location, entry points, initial activity patterns
Morning Exit (Last Movement): Confirms return routes, validates entry point theories, completes behavioral picture
Extended Window (to 7AM): Captures complete rodent activity cycle for comprehensive analysis
Hardware Solutions Born from Experience:
Deployment-Driven Innovation
These weren't theoretical improvements - they were direct responses to problems discovered through extensive field testing:
- Problem: Devices knocked over → Solution: Zip-tie mounting
- Problem: Employee false positives → Solution: Directional cone
- Problem: Missing morning activity → Solution: Extended monitoring window
Professional Value Enhancement:
Customer Workflow Integration:
Field Experience Wisdom
Key Learning: The most valuable data comes from the transition periods - when rodents enter and exit their active cycle.
Professional Impact: Exterminators could finally answer the critical question: "Where exactly are they getting in?"
Customer Value: Precise targeting reduces time, cost, and chemical usage for effective control.
Design Philosophy Evolution
This phase marked the transition from "Can we detect rodents?" to "Can we provide actionable intelligence for pest control professionals?"
Every hardware modification was driven by real customer needs discovered through actual deployment experience.
Professional Tool Validation
Complete Activity Intelligence: First comprehensive system to capture full rodent behavior cycles in active environments.
False Positive Elimination: Professional-grade filtering enables reliable operation during business hours.
Actionable Data: Precise entry point identification and travel pattern analysis for targeted intervention.
Next Challenge Identified
Success in active environments revealed the next scaling challenge: "We need this to handle much higher activity volumes in large facilities."
High-traffic commercial environments demanded architectural improvements for data throughput and processing.
Phase 6: Enterprise Scale Architecture Revolution
The Scale Reality Shock: Moving to higher activity locations revealed a dramatic scale challenge - from handling tens/hundreds of movements to thousands. Our architecture assumptions were completely wrong.
Critical System Bottleneck: The single-processor base device couldn't simultaneously listen to sensors AND upload data during high-traffic periods, causing data loss.
Unexpected Scale Challenge
INITIAL DESIGN
10s-100s
movements per nightHIGH ACTIVITY REALITY
1000s
movements per nightSYSTEM IMPACT
100%
architecture rethinkingCritical Architecture Flaw Discovered
The Problem: Single processor trying to handle both local sensor reception AND remote server communication
The Failure: During data upload periods, the antenna stopped listening to local devices
The Impact: Data loss during the busiest periods when monitoring was most critical
Customer Impact: Unreliable operation in exactly the environments where RodentRadar was most needed
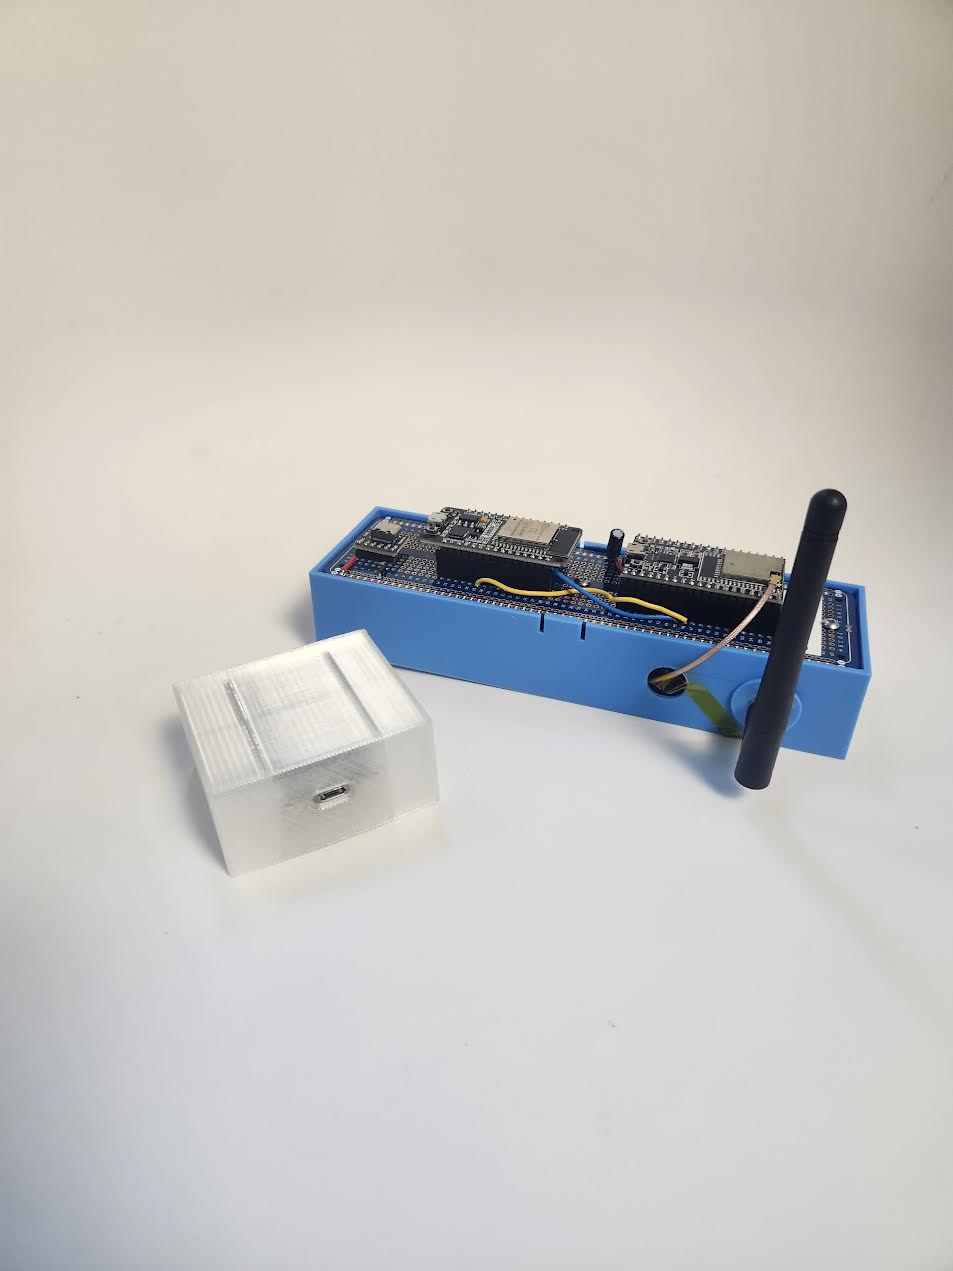
Architecture evolution: From single-processor base prototype (left) to multi-processor test bed (right) solving the throughput bottleneck
High-Load Testing Methodology
Created comprehensive test environment simulating extreme conditions:
- Stress Testing: Sensors firing data every few seconds
- Load Validation: Thousands of events per testing session
- Failure Analysis: Identify exact breaking points and data loss scenarios
- Real-World Simulation: Mirror actual high-activity deployment conditions
Multi-Layer Optimization Strategy:
Server-Side Improvements:
Multi-Processor Architecture Breakthrough
The Innovation: Split responsibilities across multiple processors with serial communication
Processor 1: Always Listening
- Dedicated to continuous sensor reception
- Never interrupted by upload tasks
- Buffers incoming sensor data
Processor 2: Always Connected
- Handles all server communication
- Manages data uploads and system updates
- Maintains persistent server connections
Serial Communication Bridge: Reliable data handoff between processors
Performance Transformation Results:
Technical Implementation Challenges Solved:
Enterprise Environment Validation
Large Restaurant Chains: Systems handling 50+ sensors across multiple zones
Industrial Facilities: Continuous monitoring in high-activity manufacturing environments
Food Processing: Regulatory compliance monitoring with zero tolerance for data gaps
Performance Requirement: 99.9%+ uptime in mission-critical applications
Business Impact Transformation:
Engineering Insight
Architecture Lesson: Single points of failure become critical bottlenecks at scale
Design Philosophy: Separate concerns - listening and uploading are fundamentally different tasks
Scalability Principle: Build for 10X expected load, not just current requirements
Enterprise Architecture Achievement
Scalability Breakthrough: Transformed from small-scale prototype to enterprise-capable platform
Reliability Proven: Zero data loss in high-demand commercial environments
Market Expansion: Enabled access to large commercial and industrial customers
Technical Foundation: Multi-processor architecture provides platform for future enhancements
Next Challenge Identified
Enterprise-scale success created manufacturing demands: "We need to move from hand-wired prototypes to manufacturable hardware."
Reliable architecture required transition to printed circuit boards for scalable production.
Phase 7: Manufacturing Scalability Transition
From Prototype to Production: Enterprise-scale success created urgent demand for manufacturable hardware. Hand-wired devices couldn't scale to meet customer requirements.
Strategic Evolution: Transitioning from custom hand-wired devices to professional printed circuit board production while maintaining proven functionality.
Manufacturing Reality Check
Hand-Wired Limitations:
- Time-intensive assembly (hours per device)
- Inconsistent quality and reliability
- Difficult to troubleshoot and repair
- Cannot scale to enterprise demand volumes
Customer Demand: Dozens of devices needed for large facility deployments
Cross-Project DuoCore Benefits
Leveraged assembly jig experience from other DuoCore projects, demonstrating how the platform's diverse project portfolio creates manufacturing synergies and shared learnings.
This wasn't starting from scratch - it was building on proven hardware development methodologies.
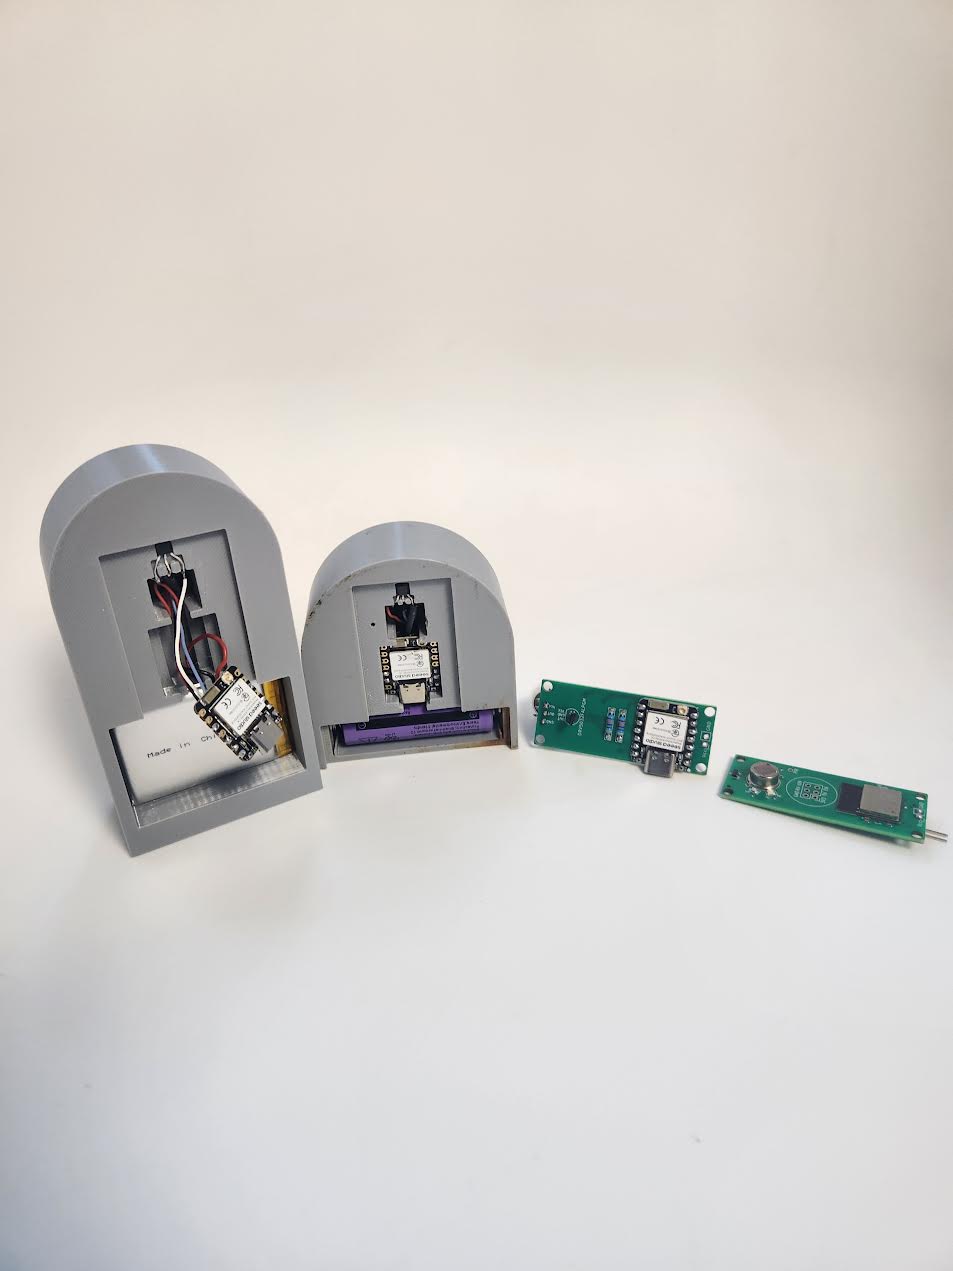
PCB evolution: Development board integration (left) to fully integrated custom design (right)
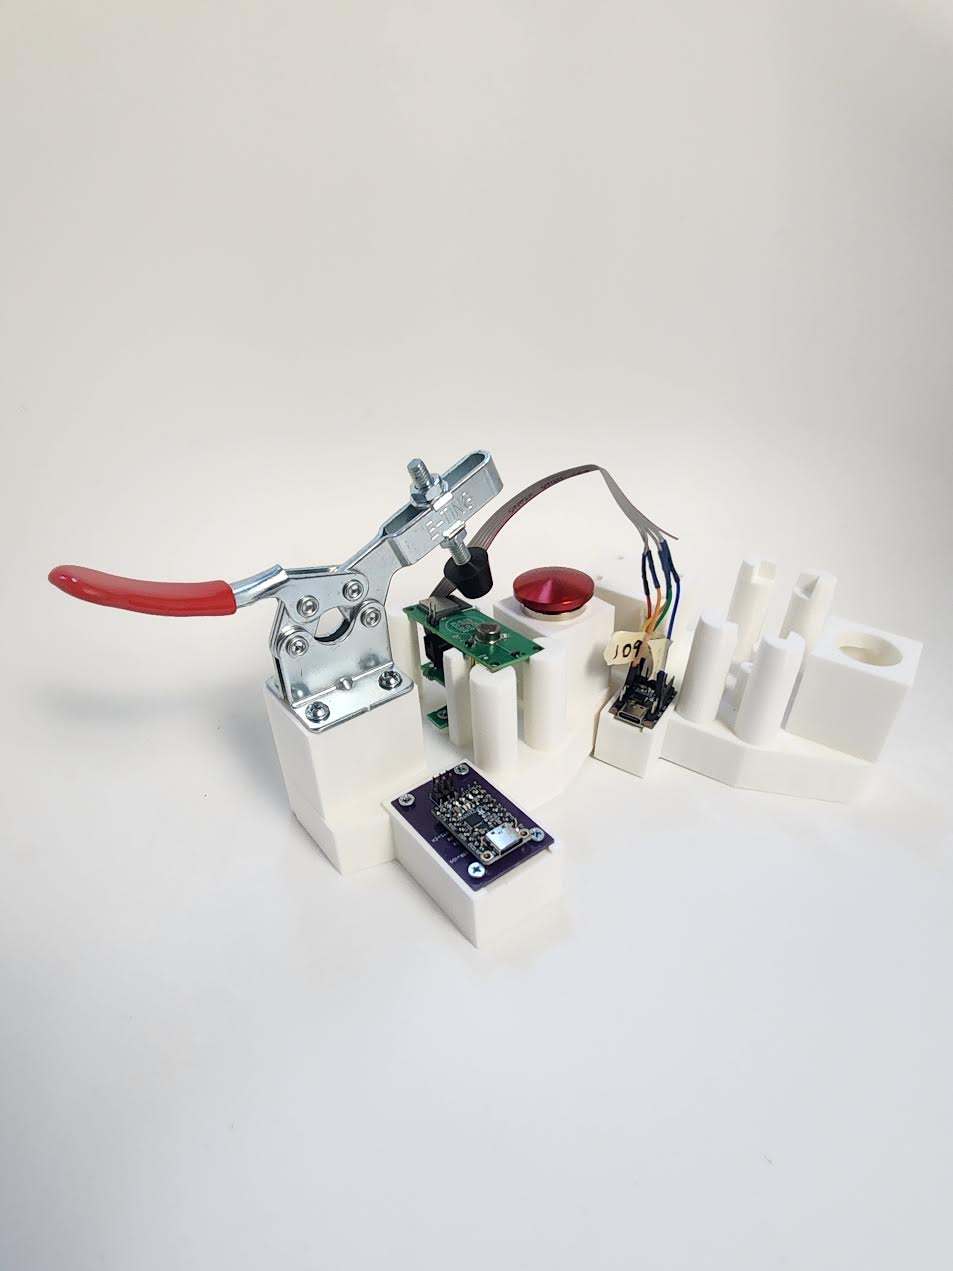
Manufacturing infrastructure: Custom programming and assembly jig streamlining production workflow
Strategic Two-Stage PCB Approach
Risk Mitigation Strategy: Rather than jumping directly to full custom design, we implemented a conservative progression:
PCB Version 1: Conservative Integration
- Mount existing development board onto PCB
- Maintain proven functionality
- Reduce assembly complexity
- Test PCB manufacturing process
PCB Version 2: Full Custom Design
- Extract processor from dev board
- Build all supporting circuitry on PCB
- Optimize for size and cost
- Complete manufacturing solution
Manufacturing Infrastructure Development:
Version 1 PCB Achievements:
Version 2 PCB Breakthroughs:
Business Model Validation
Critical Achievement: PCB manufacturing provided accurate cost-per-unit analysis for the first time
- Pricing Strategy: Real manufacturing costs enabled competitive pricing
- Volume Economics: Understanding of scale benefits and break-even points
- Investment Planning: Accurate data for business case development
- Market Positioning: Cost structure supporting professional market pricing
Production Capability Transformation:
Manufacturing Lessons Learned
Conservative Progression: Two-stage approach reduced technical risk while enabling learning
Jig Investment: Upfront tooling costs paid back quickly through assembly efficiency
Quality Systems: Consistent processes more important than individual craftsmanship
Cost Transparency: Real manufacturing data essential for business viability
Customer Impact Benefits:
Manufacturing Readiness Achieved
Production Capability: Transition from prototype workshop to professional manufacturing
Business Viability: Accurate cost structure enabling competitive market pricing
Quality Assurance: Consistent, reliable products for enterprise deployments
Scalability Foundation: Infrastructure ready for rapid volume increases
Next Challenge Identified
Manufacturing capability created operational demands: "We need remote management and update capabilities for deployed devices."
Volume deployments required sophisticated device management and over-the-air update systems.
Phase 8: Remote Management & Platform Integration
Operational Transformation: With stable software and PCB manufacturing established, RodentRadar was ready for integration into the comprehensive DuoCore hardware management platform.
Enterprise Requirement: Volume deployments demanded remote management capabilities - devices scattered across multiple locations needed centralized control and updates.
Operational Scaling Challenge
Volume Deployment Reality: Success created logistical challenges
- Dozens of devices per customer installation
- Multiple customer sites across wide geographic areas
- Frequent software improvements and bug fixes
- Need for proactive device health monitoring
Manual Management Crisis: Physical device retrieval for updates was completely impractical at scale
DuoCore Platform Integration Benefits
Rather than building custom management infrastructure, RodentRadar leveraged the mature DuoCore hardware platform:
- Proven Infrastructure: Battle-tested across multiple hardware projects
- Shared Development Costs: Platform improvements benefit all 36in36 projects
- Cross-Project Learning: Management features refined by diverse project needs
- Rapid Integration: Existing APIs and workflows accelerate deployment
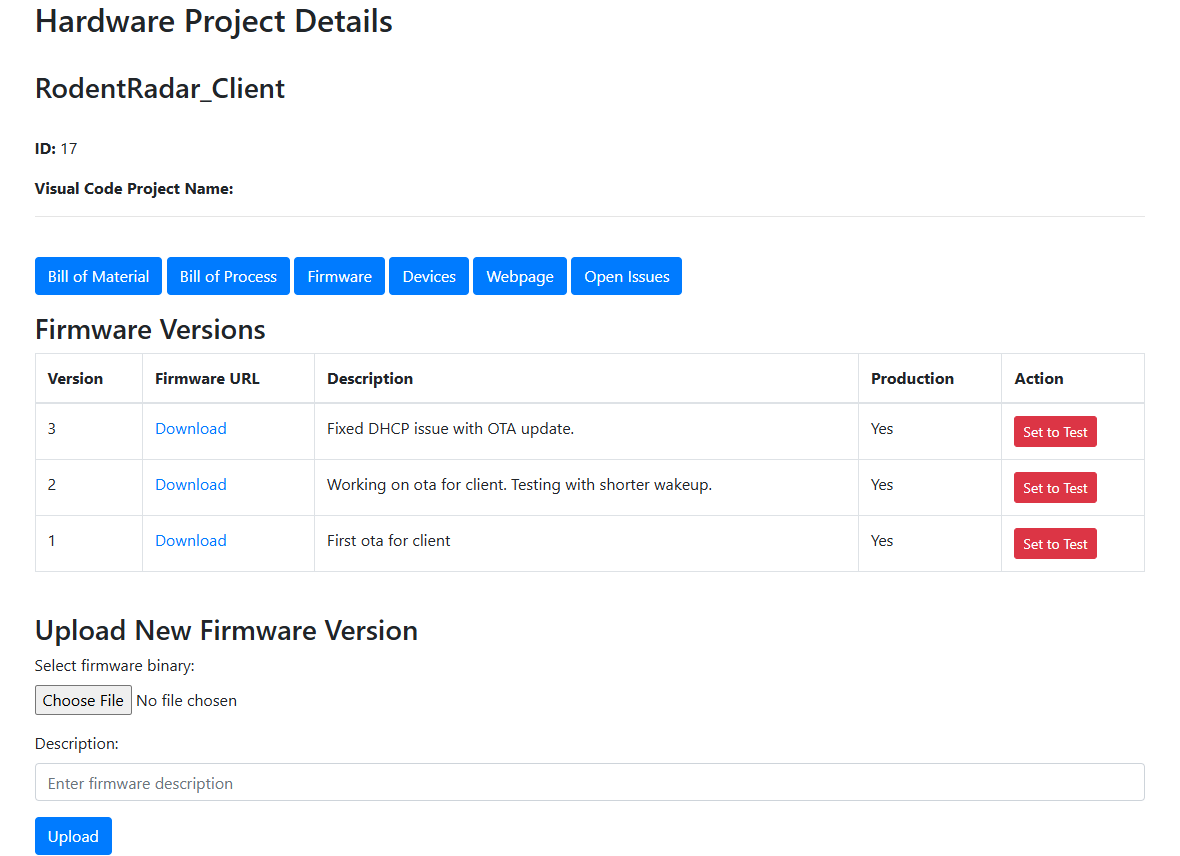
DuoCore platform interface: Comprehensive device management, OTA updates, and remote monitoring capabilities
Simplified Network Architecture
Customer-Friendly Setup: DuoCore platform includes intuitive local provisioning
Base Device Network Setup
- Simple web interface for WiFi configuration
- One-time setup per installation
- No IT expertise required
- Automatic connection management
Sensor Network Simplicity
- Sensors connect only to base device
- No individual network configuration
- Automatic sensor discovery and pairing
- Simplified troubleshooting
Over-the-Air Update Capabilities:
Proactive Device Health Monitoring
Comprehensive Telemetry: Real-time visibility into device status across entire deployment
Battery & Power
- Real-time battery level monitoring
- Power consumption trend analysis
- Low battery proactive alerts
- Charging cycle optimization
Connectivity & Performance
- Signal strength monitoring
- Data transmission success rates
- Device responsiveness metrics
- Network connectivity diagnostics
Operational Revolution
BEFORE OTA
- Physical device retrieval
- Manual firmware updates
- Days/weeks for deployment
- Reactive customer support
AFTER OTA
- Complete remote management
- Automatic updates
- Minutes for global updates
- Proactive issue prevention
Enterprise Deployment Benefits:
Customer Experience Transformation:
Scalability Achievement
Infrastructure Capability: Platform can manage hundreds or thousands of deployed devices from central location
Operational Efficiency: Single administrator can oversee entire deployed fleet
Cost Structure: Remote management eliminates field service costs for updates and maintenance
Market Enablement: Operational scalability supports rapid business growth
DuoCore Ecosystem Value
Platform Benefits: RodentRadar gains enterprise-grade management capabilities without custom development
Shared Innovation: Platform improvements from other projects benefit RodentRadar automatically
Cross-Project Synergies: Management interface optimized by diverse hardware project requirements
Development Efficiency: Focus on core product features rather than infrastructure development
Enterprise Operations Readiness
Remote Management Mastery: Complete operational control without geographic limitations
Proactive Service Model: Issues prevented rather than reactively addressed
Scalable Infrastructure: Platform ready for rapid deployment expansion
Professional Credibility: Enterprise-grade management capabilities competitive with major IoT platforms
Next Challenge Identified
Remote management success revealed field operation needs: "Exterminators need devices that stay in place for continuous monitoring."
Professional workflow requirements demanded rethinking of battery architecture for field serviceability.
Phase 9: Professional Workflow Battery Revolution
Professional Reality Check: Early exterminator feedback revealed a critical workflow requirement - devices must remain in exact positions for continuous behavior analysis, not be removed for charging.
Design Philosophy Shift: From integrated rechargeable devices to user-replaceable battery systems, enabling field serviceability without disrupting monitoring continuity.
Professional Use Case Revelation
Exterminator Workflow Critical Insight: Tracking rodent behavior changes after exclusion work requires consistent device positioning and continuous data from the same sensor over time.
The Professional Question: "Did the sealing work?" "Are they finding new entry routes?" "How has activity changed?"
Data Requirement: Uninterrupted monitoring from identical sensor location to validate intervention effectiveness.
Original Design Flaw
ORIGINAL CONCEPT
Remove device → charge → return
Disrupts continuous monitoringPROFESSIONAL REALITY
Device must stay in exact position
Continuous data essential
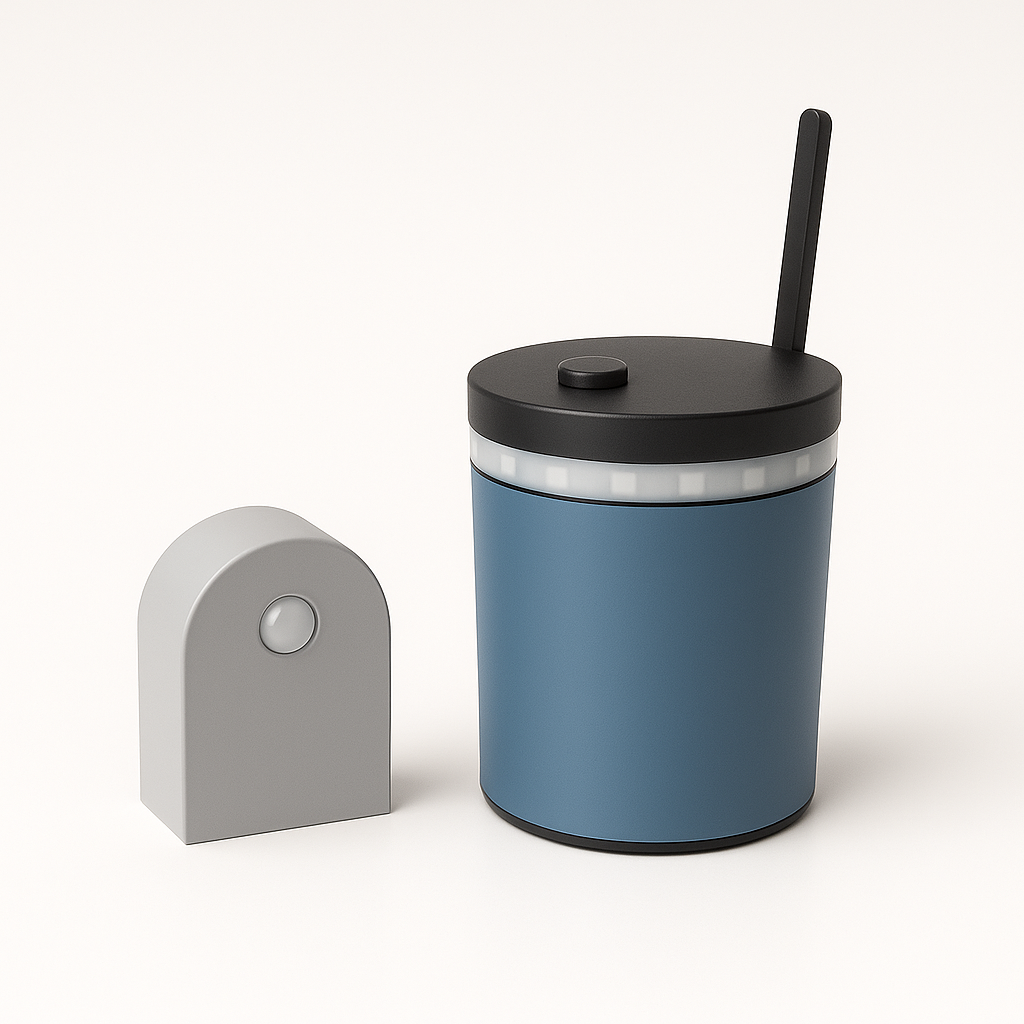
Original Design: Large integrated battery
New Design: Compact replaceable battery
Customer-Centric Design Decision
Two Possible Solutions:
- Complex Software Solution: Modify reporting system to track device swaps and maintain data continuity across multiple devices
- Simple Hardware Solution: Replaceable battery system - device stays put, only battery swapped
Chosen Approach: Adapt our system to professional workflow rather than forcing technicians to adapt to our system complexity.
Professional Workflow Analysis:
Replaceable Battery System Benefits
Operational Benefits
- Device remains in exact position
- Continuous data stream maintained
- Quick 30-second battery swap
- No recalibration required
Technician Benefits
- Minimal workflow disruption
- No device tracking complexity
- Simple field maintenance
- Reduced service time per location
Unexpected Engineering Benefits:
Manufacturing Impact
Unexpected Benefit: Compact battery design reduced overall device footprint
ORIGINAL
Larger Housing
More printing timeNEW DESIGN
Compact Housing
Faster productionProfessional Value Demonstration:
Customer Workflow Integration:
Design Philosophy Learning
User-Centric Approach: Best engineering solutions adapt to user workflows, not vice versa
Professional Requirements: Real user feedback reveals requirements not obvious in lab testing
Simplicity Wins: Hardware solution often better than software complexity
Secondary Benefits: User-focused design improvements often create unexpected advantages
Professional Workflow Mastery
Continuous Monitoring: Uninterrupted data collection for professional analysis
Field Serviceability: Simple maintenance without disrupting operations
Manufacturing Efficiency: Compact design reduces production time and cost
Professional Credibility: System designed around real exterminator workflow requirements
Next Challenge Identified
Professional deployment success revealed infrastructure needs: "We need better communication range and reliability across different building types."
Real-world deployment environments demanded comprehensive antenna optimization and range testing.
Phase 10: Communication Infrastructure Mastery
Foundation Infrastructure Challenge: Ensuring reliable communication across various building types, materials, and distances was critical for professional deployment success.
Significant Engineering Investment: Comprehensive time investment in both processor antenna selection and base device antenna optimization to maximize sensor placement flexibility.
Real-World Deployment Challenges
Building Complexity Factors:
- Construction Materials: Concrete, steel, brick walls affecting signal penetration
- Facility Layouts: Long corridors, multiple floors, complex floor plans
- Environmental Interference: Other wireless devices, electrical equipment
- Distance Requirements: Large facilities demanding extended communication range
Professional Requirement: Reliable operation regardless of building constraints
Dual Antenna Optimization Strategy
Comprehensive Approach: Significant engineering time invested in optimizing both ends of the communication link
Processor Antenna Selection
- Extensive research and testing
- Balance size, power, and performance
- Sensor device constraints consideration
- Multiple antenna technologies evaluated
Base Device Antenna Enhancement
- Dedicated antenna system added
- Range and reliability optimization
- Professional appearance maintained
- Signal strength maximization
First customer-acceptable version: Base device with visible antenna for enhanced range and LED status indicators for user feedback
Range Extension Achievement
BEFORE
Limited Range
Constrained sensor placementAFTER
Extended Range
Flexible sensor positioningBase device antenna greatly improves sensor placement distances
Comprehensive Testing Methodology:
Customer-Ready Design Features:
Engineering Time Investment
Significant Commitment: Substantial time spent on antenna optimization demonstrates commitment to robust, reliable field performance
Foundation Priority: Understanding that poor communication undermines all other sophisticated capabilities
Professional Standards: Meeting enterprise-grade reliability requirements for commercial deployment
Real-World Deployment Benefits:
Commercial Environment Validation:
Infrastructure Philosophy
Foundation First: Reliable communication is prerequisite for all advanced features
User Experience Impact: Poor signal strength creates customer frustration regardless of software sophistication
Professional Credibility: Enterprise customers expect robust, reliable infrastructure performance
Competitive Advantage: Superior range and reliability differentiates from basic sensor solutions
LED Status System Benefits:
Communication Infrastructure Mastery
Extended Range Capability: Sensor placement flexibility maximized for optimal detection positioning
Professional Reliability: Consistent performance across diverse commercial building environments
Customer-Ready Design: Professional appearance with clear operational status indication
Deployment Simplification: Reduced infrastructure requirements for comprehensive facility coverage
Next Challenge Identified
Reliable communication infrastructure enabled focus on user experience: "Customers need simpler setup and device management procedures."
Professional deployment success revealed the importance of streamlined customer workflow integration.
Phase 11: Intuitive User Experience Revolution
User Experience Crisis: Technical success meant nothing if customers couldn't easily set up and manage devices. Complex procedures were killing adoption and creating support burden.
Professional Mobility Challenge: Exterminators needed seamless device transport between different job sites across town, requiring completely streamlined setup processes.
User Experience Barriers
Setup Complexity Issues:
- Complex device activation procedures
- Confusing sensor identification and placement
- Battery life uncertainty during shipping and storage
- Time-consuming setup for each new location
Professional Impact: Exterminators losing billable time on technology setup instead of pest control work
Shipping Mode Innovation
Battery Preservation Strategy: Devices ship in low-power "shipping mode" preserving battery capacity during storage and transport
Activation Simplicity: Single intuitive action transforms device from shipping mode to active detection mode
Customer Benefit: Devices arrive with maximum battery life, ready for immediate extended deployment
Intuitive activation system: Small round disc on base device top for sensor wake-up, with LED feedback confirming successful activation
Revolutionary Wake-Up System
Activation Method: Sensor device swiped over small round disc on top of base device
Instant Transformation: Device awakens from shipping mode to ready-to-detect state
Visual Confirmation: LEDs immediately provide feedback confirming successful activation
Professional Workflow: Eliminates complex setup procedures for multi-location deployments
LED Feedback System
Two White Flashes
Sensor activation detected
Two Green Flashes
Sensor ready for placement
Visible on both customer dashboard AND base device LEDs
Professional Multi-Location Workflow:
Alphabetical Organization System
Sensor Labeling: Each sensor clearly labeled with letter (A, B, C, etc.)
Physical Placement Guide: Technicians and property owners place sensors in alphabetical order
Digital Interface Matching: Floorplan interface displays sensors in same alphabetical sequence
Intuitive Correlation: Perfect match between physical placement and digital representation
Floorplan Integration Benefits:
Error Prevention & User Confidence:
Complete User Journey Optimization
Shipping to Setup Pipeline:
- Factory: Device ships in low-power mode with maximum battery
- Transport: Minimal power drain during shipping and storage
- Arrival: Customer receives device ready for extended deployment
- Activation: Single swipe transforms to active detection mode
- Deployment: Alphabetical placement with digital interface correlation
- Operation: Immediate productive monitoring begins
Professional Workflow Integration:
User Experience Design Philosophy
Invisible Complexity: Sophisticated technology hidden behind simple interactions
Professional Respect: Technology adapts to professional workflows, not vice versa
Error Elimination: Design prevents mistakes rather than relying on user training
Immediate Feedback: Visual confirmation builds user confidence and prevents uncertainty
Business Impact Transformation:
User Experience Mastery Achievement
Intuitive Activation: Single swipe transforms shipping mode to operational readiness
Visual Feedback System: LED confirmation eliminates setup uncertainty and builds confidence
Professional Workflow Integration: Multi-location deployment without complexity or reconfiguration
Error-Resistant Design: Alphabetical organization and visual feedback prevent common mistakes
Battery Optimization: Maximum deployment time through intelligent shipping mode preservation
Market Ready Achievement
User experience optimization completed the transformation from technical prototype to market-ready professional solution. RodentRadar now offered enterprise-grade detection capabilities with consumer-grade simplicity.
Ready for Scale: All technical, operational, and user experience challenges addressed for rapid market expansion.
Market Validation: Organic Discovery Success
Encouraging Organic Discovery: Posted rodentradar.com with no promotional activities, yet seeing meaningful organic discovery by people actively seeking monitoring solutions.
Professional Market Validation: Early contact from large Southern California exterminator specifically requesting "24x7 monitoring system for their customers."
Genuine Market Demand
Baseline Reality: Most development websites receive zero traffic before promotion
RodentRadar Discovery: Multiple visitors finding the site through active searches for monitoring solutions
Market Signal: People are actively looking for exactly what we built
Professional Market Validation
Contact: Large exterminator company in Southern California
Request: "24x7 monitoring system for their customers"
Significance: Professional service provider seeking exactly what RodentRadar provides
Market Fit: Direct alignment with core value proposition
Market Readiness Indicators:
Ready for Growth
Organic discovery by both end customers and professional service providers suggests strong market readiness for proactive rodent monitoring solutions, supporting the timing for broader marketing and sales efforts.
Current State: Proven Technology Foundation
From basic communication proof-of-concept to comprehensive IoT solution with validated detection capabilities, visual analytics, and professional deployment features. While we have a long way to go, continued methodical improvement positions us for market success.